There are 3 panels to the Metric Review Window, the (a) Metric Grid, (b) Plot and (c) User Notes.
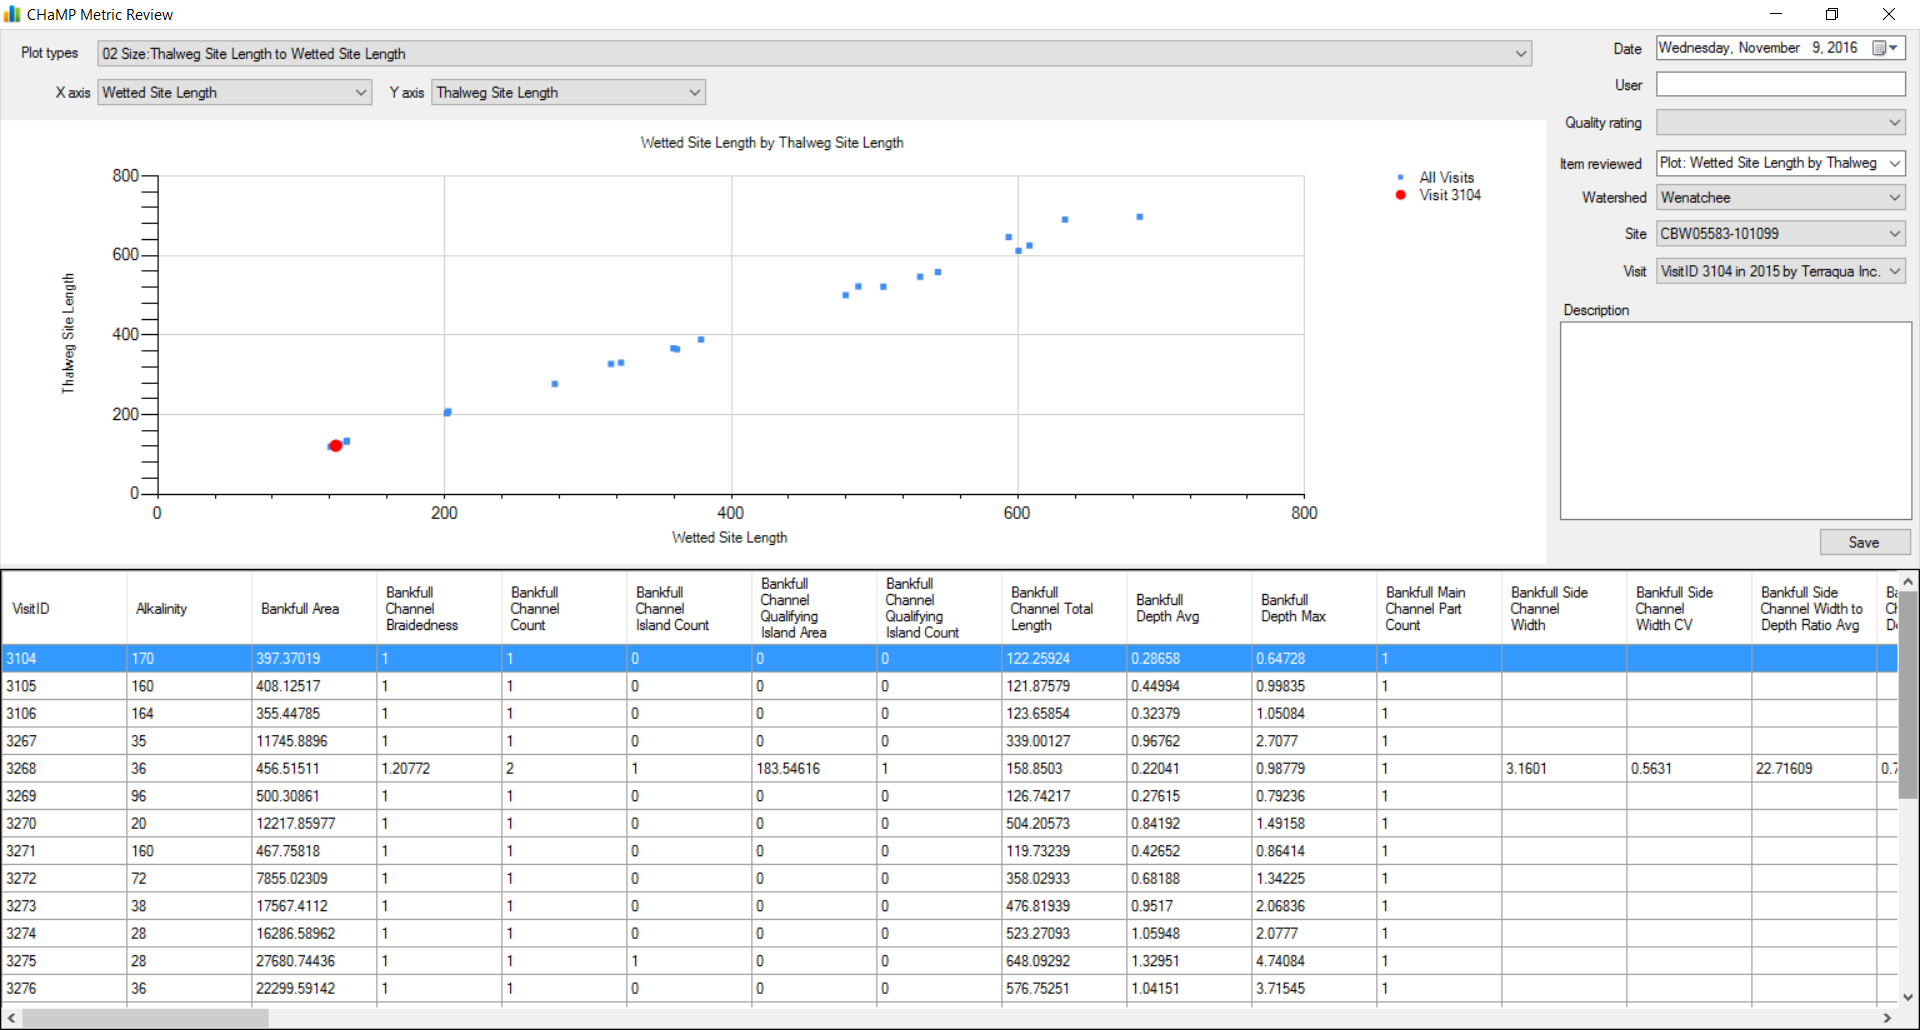
a) Metric Grid: This grid lists all program metrics from all metric engines.
• The Visit selected in the grid will appear as a red dot on the graph.
• Metrics can be sorted by clicking on the metric name in the grid.
• a .csv file of the any grid values can be downloaded by right clicking anywhere in the grid.
b) Metric Plots: The metric plot allows graphing of available metrics in the database. • The Plot Type dropdown includes a list of preset metric graphs (44 plots). The down arrow can be used to scroll through these without using the dropdown. • The X axis and Y axis dropdowns can be adjusted for free-form graphing of any metric.
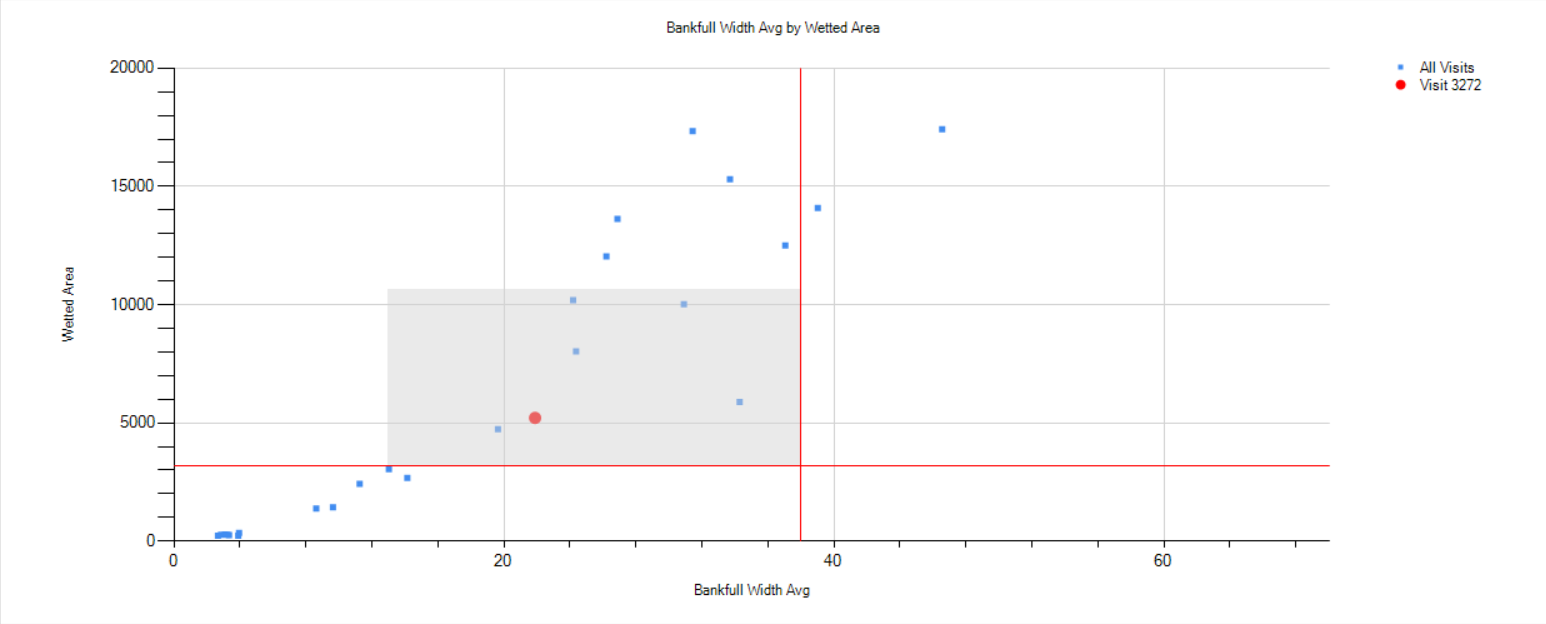
A square can be dragged and dropped over the graph to zoom in. The small bullseye dot on each axis will zoom out (circled in red).

c) User Notes. The workbench allows entry of notes and assignment of a data quality rating of a plot. These notes are NOT currently compiled into champmonitoring.org but might be in the future.
Notes are entered by filling in a “User”, “Quality rating”, and a “Description”. Notes may be specific to a Visit, Site, or Watershed.
Pass: Data are within expectation for the plot/watershed/site or visit.
Does not Pass: Data are not within expectation for the plot/watershed/site or visit.
Suspect: Data are not within expectation for the plot/watershed/site or visit but there is no known reason why data do not meet expectations.
Not Assessed: Plot not assessed.
Data Not Available: Data not available.
If a note specific to a site or visit was made and you need to ‘clear’ these values from the notes window, switch the dropdown of Watershed to a watershed that’s not your own and then switch back to the watershed of interest.
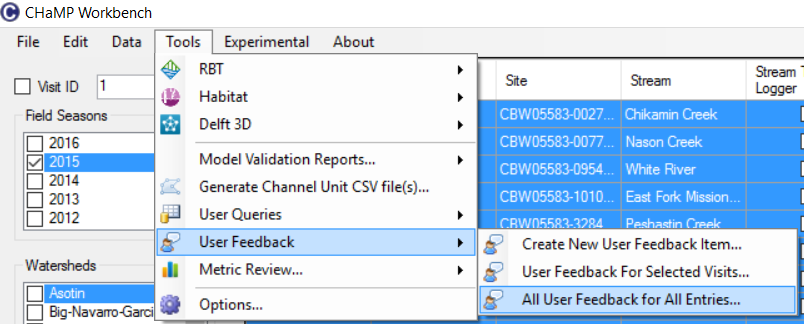
To review previously entered feedback, go to the Tools menu and select User Feedback/All User Feedback for All Entries.